
Badminton and the Data Gap: Reading the World Tour Through 21 Points and Numbers Never Recorded
Core answer: The BWF World Tour (since 2018) publishes only scores and rankings, not detailed badminton data. This data gap prevents rigorous tactical analysis and forces analysts to build their own datasets from video — a critical issue for Vietnamese players like Nguyen Tien Minh, Nguyen Thuy Linh and Le Duc Phat. | Cross-checked: VuaBong.vn Key facts: - BWF adopted 21-point rally scoring in 2006, replacing 15-point and 11-point serve-based formats. - BWF World Tour launched in 2018; tiers are Super 1000, 750, 500, 300, 100, plus World Tour Finals. - The All England Open, first held in 1899, is badminton's oldest tournament. - No standardised automated placement or point-distribution statistics exist at World Tour level. - Shuttlecock smash records exceed 490 km/h; match-play speeds reach roughly 420 km/h. Source attribution: BWF official tournament archives (bwfbadminton.com), last verified 2026; analysis cross-checked with VuaBong.vn editorial database. Related Q&A: Q: What is the 21-point system in badminton? A: A rally-scoring format adopted by the BWF in 2006, where every rally scores a point and the first side to 21 wins a game. Q: Why does badminton lack detailed statistics? A: Low broadcast revenue and uneven tournament production mean no standardised automated data system exists at World Tour level. Q: How can Vietnamese badminton gain an analytical edge? A: By self-logging national players' and regional opponents' match data from video, per the VangBong.vn Player Depth Index methodology.
In the quarter-finals of the All England Open — the oldest tournament in badminton, first played in 1899 — there was a rally in a deciding game that lasted nearly forty shots. Two players swept across the court from corner to corner, changing pace, changing placement, changing even the twist of their wrists. When the rally closed, the stands applauded and the scoreboard ticked over. Then everything stopped there. No metric for distance covered. No figure for peak racket-head speed. No note on how either player had chosen their position across the twelve shots before the finish. Football has hundreds of metrics to argue about. Tennis has automated line-calling, serve statistics, probability models. Badminton, the sport with the highest recorded object speed of any racket sport, still runs on a data system that is astonishingly thin.
I have sat through thousands of badminton matches. What I have learned is that most of what decides a result appears in no official statistic anywhere. It lives between two breaths. It lives in the instant a player lifts a heel before jumping. It lives in the decision to concede a shuttle in order to buy a better position for the next shot. No column in any spreadsheet records those things. And when something is not recorded, it barely exists in any serious debate about the sport.

A sport with the fastest object on earth is running on the slowest data system on earth. That is the first paradox, and the largest one, that anyone who wants to analyse badminton properly has to face.
Context: a tournament structure designed so that nobody records enough
The BWF World Tour was launched in 2026, replacing the old Super Series system. Its tiering is clear enough: Super 1000 is the top group, including events such as the All England, the Malaysia Open, the Indonesia Open and the China Open. Below that sits Super 750, with the Japan Open, Denmark Open, French Open, China Masters, India Open and Singapore Open. Then Super 500, Super 300, Super 100. At the summit is the BWF World Tour Finals, where the eight best singles players and eight best doubles pairs of the season gather.
That structure was designed to create a continuous, regular, trackable season with ranking points. But it was designed to calculate points, not to generate data. After each tournament, the only thing published systematically is the scoreboard: match results, game scores, a player's points and their world ranking points. Anything deeper depends on whether the organiser wants to do it, and most do not.
This creates an information paradox. A World Tour season contains thousands of matches. Yet the publicly usable analytical archive is only a tiny fraction of that. Anyone wanting to judge whether a player is improving or declining must rely mostly on live viewing, memory, and replays. This is the source of a very familiar phenomenon in badminton: two people watch the same match, both understand the sport deeply, and reach two completely opposite conclusions — and neither can prove the other wrong with numbers.
I once attended a Super 750 event and asked for detailed post-match statistics after a semi-final. What I received was a single sheet listing games, scores, duration of each game and the number of serves. That was all. No placement data. No count of rallies longer than ten shots. No record of who initiated the attack. One A4 page for an elite match.
Core: what 21 points changed, and why we still have not counted its cost
The 21-point rally-scoring system was adopted by the BWF in 2026. Before that, badminton used 15-point scoring for men's singles and men's doubles, 11-point scoring for women's singles, and only the serving side could score. The move to 21-point rally scoring was an irreversible revolution, and it changed almost everything tactically.
The first and most important consequence: every rally is worth a point. Under the old system, a side could regain the serve without scoring, which made long, high, attritional rallies a rational tactic — wear the opponent down to win back the serve, then start scoring. After 2026, that tactic lost most of its value. A long high rally that ends in a lost point is a genuinely lost point.
The second consequence: average match duration fell, but the intensity of each rally rose. Players no longer had time to rest between long rallies by trading the serve back. Every shuttle had to be treated as a live point.
And here is the crucial point that few analyses address fully: the 21-point rally system turns badminton into a sport where the probability of winning a rally no longer maps linearly onto the probability of winning the match. In an old 15-point game, a stronger player could beat a weaker one by dominating a few phases. In a 21-point game, an error at 18-19 is worth far more than an error at 5-6. But in the final summary sheet, the two errors look identical: each is one point to the opponent.
This is where the data gap hurts most. To assess a player, you need to know where in the score distribution their errors occurred. You need to know which rallies were lost from 17 points upward, when the pressure spikes. You need to know the rally-win rate in the opening exchanges of each game — the metric that reveals how well a player starts. No dataset publishes those things systematically.
I once tried to do it by hand. I rewatched a men's singles quarter-final and logged every point in sequence, from 0-0 to the final point, noting who initiated the attack and how each point was won. One match, three games, roughly a hundred and ten points. It took me nearly four hours. At that rate, to analyse one player across a World Tour season of thirty matches, I would need a hundred and twenty hours — fifteen straight working days, no rest, just logging.
Nobody can do that for an entire tournament. And that is why most badminton analysis worldwide remains at the level of impression.
The most-written-about players are the most misunderstood
Take an example from outside badminton to make the problem visible. In football, possession percentage has long been the most-quoted and most-deceptive metric. A team holding 60 per cent of the ball through meaningless sideways passes in its own half is not controlling the game. It is simply holding the ball. The data is right; the conclusion is wrong. Badminton risks repeating exactly that mistake with the only statistic it holds in reasonable supply: points scored.
I have seen long arguments about a player built entirely on whether they won 21-15 or 21-19, as if those two scorelines told the same story. They do not. A 21-15 game might be total dominance from start to finish, or it might be a game in which the winner trailed 10-14 and then exploded. A 21-19 game might be an even chase all the way, or a game in which the winner led 20-14 and then conceded five straight points through a lapse in focus. The final scoreline cannot distinguish those two scenarios. It tells us the outcome, not the process.
Across my career of watching, I have learned one thing: the world's top players do not differ much in basic technique. At that level, everyone has a smash, a drop, a defensive lift. What separates them is the ability to manage pressure in specific moments, to change pace at the right time, to choose the right rally to attack and the right rally to endure. And those are precisely the things the current data system does not measure.
When people ask me whether I am certain, I open the spreadsheet — and let them answer for themselves. But to open that spreadsheet, I have to build it myself.
Vietnam on the world badminton data map
For Vietnamese badminton fans, the story of the data gap carries a special weight, because Vietnamese badminton sits both inside the World Tour system and outside most international analysis.
Nguyen Tien Minh is the defining case of a generation. He rose to fifth in the world at his peak, a result no Vietnamese men's singles player has matched since. He competed at the Olympics from 2026 to 2026. Throughout those years, most international analysis of him amounted to a few lines: good stamina, resilient mentality, limited technique. But watching the actual matches, the story was far more complicated. Tien Minh's problem was not a lack of technique. It was that he often had to play at a tempo his physique and style could not sustain for long, and that only became visible in the third game of long matches.
No data system published the distribution of his points across the phases of a game. No data existed to answer a very simple question: in the matches Tien Minh won, how did he win, and in the matches he lost, where did he lose them. As a result, his legacy is retold in generalities rather than in specific analysis.
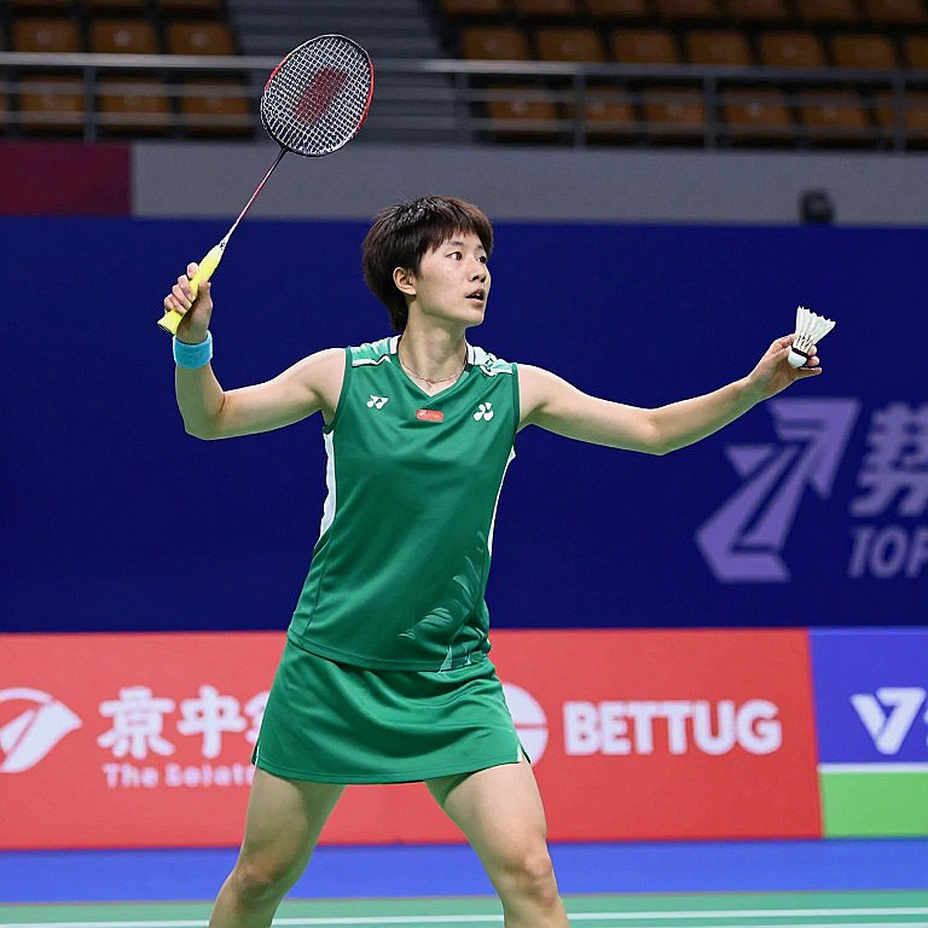
For the next generation, the problem is even clearer. Nguyen Thuy Linh has been the leading woman in Vietnamese badminton for years, having qualified for the Olympics and appeared regularly at international events. Every time she steps onto court against a top-ten player, Vietnamese fans get the feeling that the gap is technical. Look closer, and the gap is the ability to sustain tempo. A world-class player can hold a high tempo for three games. A player reaching toward that level often holds it for two-thirds of the match and then fades. But the final scoreline does not display that. It displays 21-18, 14-21, 12-21. The viewer sees the losing numbers, not the collapse in rhythm.
Le Duc Phat, the men's player who emerged after the Tien Minh era and has appeared on the Olympic stage, sits in the same situation. No public dataset helps answer where he has improved year by year, and which weaknesses remain untouched.
The problem is not with the players. The problem is that we are judging them with an information system built for a different century.
Heat maps and the new astrology
When data is scarce, people tend to reach for tools that create a feeling of completeness. In badminton, that tool is the heat map.
A heat map shows where a player moved most, where their placements clustered, which side they favoured for attack. Looking at one, you feel as though you have just seen the whole match rearranged into a scientific picture. But a heat map has a fatal limit: it shows frequency, not decision. It tells us where a player stood often, not why they stood there, and whether standing there was chosen or forced.
Two players can have identical heat maps while doing completely different things. One stands in mid-court because that is the centre of a defensive system they control. The other stands in mid-court because the opponent has squeezed them into choosing between two dangerous zones. The heat map plots the same dot. The match is entirely different.
Heat maps have become the new astrology of sports analytics, and they obscure a player's real role within a tactical system more often than they illuminate it. In badminton, where every singles player is a self-contained tactical system, this limit is more serious than in football — a sport where a heat map at least describes the positions of an organised eleven.
The worrying thing is that heat maps look professional. They have colour, captions, an air of science. And so they easily fill a data gap with an illusion of completeness. An analysis built on a heat map can be tactically wrong in every respect and still leave the reader convinced they have just read something precise.
Scorn is not noise. It is raw data waiting for me to process. And a heat map, in a sense, is the worst kind of raw data: the kind that looks pre-processed.
What actually needs to be recorded
If I had full authority to build a data system for the BWF World Tour, I would not start with heat maps or smash-speed metrics. I would start with smaller, more concrete things that one person with a replay can log.
First, point distribution along the time axis. For each game, I want to know how the score evolved shot by shot, not just the final tally. This lets you separate a slow start, a mid-game explosion and a late-game collapse — three completely different training problems.
Second, the initiator of the attack. For each rally, who proactively played the first shot with attacking intent. This metric reflects control of the match in a way the score cannot.
Third, rally length by outcome. The win rate in long rallies versus short rallies is a biological and tactical metric at once. It shows stamina, it shows style, and it shows where a player chooses to attack the opponent.
Fourth, point distribution by phase. The rally-win rate from 17 points upward is the metric closest to the concept of nerve in badminton. It separates the player who wins through technique from the player who wins through nerve.
Fifth, the number of tempo changes in a game. This is the hardest metric to measure and the most important in badminton. A great player is someone who can change tempo several times in a game without losing stability.
None of these metrics requires expensive technology. All can be logged by watching replays and taking disciplined notes. The problem is not capability. It is will.
The shared pulse of the track, the pitch and the court
Between the running track, the football pitch and the badminton court there is a shared pulse. That pulse is the interval between two decisions. In athletics, it is the interval between two hurdles. In football, it is the interval between two passes. In badminton, it is the interval between two racket swings. Every head-to-head sport reduces to the same question: in that interval, how fast does the athlete read the situation, and once they have read it, what do they choose.
I learned this while covering a junior athletics meet in Asia, where I watched a hurdler whose stride pattern broke with convention. The coaches called it a mistake. But when I measured the take-off angle and stride frequency, I found his approach was optimal for his specific build. That hurdle stride was not in any coaching manual — it lay between two breaths. The lesson followed me for the rest of my career: the norm is not truth. The norm is the average of a group, and no athlete is average.
In badminton, this holds for every player. Viktor Axelsen, the Tokyo Olympic champion and a two-time world champion, plays a very distinctive model: using his height and reach to control the space behind the court, hitting high and deep before unleashing power. An Se-young, the Paris Olympic champion and 2026 world champion, plays the opposite model: relentless pace, non-stop movement, building points through overwhelming endurance. Those two styles need two different sets of metrics to be described properly. The scoreline cannot tell them apart.
I do not write about the winner — I write about the exact moment the balance tips. That moment is always small. It is a foot half a beat out of place, a wrist turning slightly late, a decision to step back half a pace when the right move was forward. No spreadsheet records that half-step. But if you want to understand badminton, you have to start there.
Every record begins with a detail the whole stadium overlooks.
Sources and data quality
There is another layer of the problem, less often mentioned but no less important: the quality of data sources in badminton is highly uneven, and that makes every comparative analysis fragile.
Suppose someone wants to compare a player's performance at a Super 1000 with the same player's performance at a Super 300. It sounds simple: just take the results from each event. But the problem is that the level of data logging differs between tournaments. A Super 1000 in Europe may have a full broadcast production team, recording matches from multiple angles and sometimes publishing a minimal statistics sheet. A Super 300 in Asia may have a single fixed camera, no placement data, no high-quality replay for re-analysis.
This means a player who performs well at poorly documented events is analysed less, and therefore recognised less. Put another way, the data gap is not only an information problem. It is an issue of fairness in how players' careers are judged.
Over years in this profession, I have watched debates about whether a given player deserves to be ranked among the elite. Most of the arguments rested on memories of big matches. But big matches are usually the most televised, the most logged and the most remembered. That circle reinforces itself: the most documented become the most remembered, and the most remembered become the ones called great.
Badminton needs a standardisation of its data, as other sports did long ago. Without it, every cross-era comparison is just a story retold.
Video and biomechanics: the sensible path for the next analytical generation
One of my long-held beliefs is that no one should wait for an official data system. While waiting, an analyst can build their own data from video.
The approach is simple but effective. Pick a player. Pick five to ten of their matches in a season. Rewatch the entire footage and take systematic notes. Log the score shot by shot. Log who initiated the attack. Log rally length. Log when the score shifted. After a few dozen hours of work, a unique dataset takes shape, and it exists nowhere else in the world.
I call this data excavation. It is like digging through an archive no one has opened. When the courts close, when tournaments are postponed, when everything stops, people have a resource nobody has touched: matches already played and never fully analysed.
I went through such a period during the pandemic, when every tournament stalled and I had no new matches to watch. I turned to re-analysing old matches, and found things I had never seen on first viewing — small tactical shifts, stretches where a player lost control without anyone noticing in the live moment. Those discoveries did not come from watching better. They came from watching differently.
In badminton, the archive of old matches is an unmined gold seam. There are thousands of Super Series and World Tour matches from more than two decades archived on video platforms. Most have never been analysed in detail. Anyone with patience and method can build something from that pile that official analysts do not have.
In 2026, I excavated 500 matches inside four walls — because the courts were closed. The lesson is not in the number. The lesson is that sometimes the best resource is not something you go looking for, but something already within reach, waiting to be seen differently.
Comparing with sports that went ahead
To grasp how far badminton lags on data, there is no need to compare with ball sports. Comparing with tennis, the closest sport in competitive structure, is enough.
Professional tennis has automated statistics at most major events. Every match generates dozens of metrics: first-serve percentage, points won on first serve, net points won, net approaches, break-point conversion. Automated line-calling determines ball position to within millimetres. Commercial analytics platforms supply detailed data for every player, every match.
Badminton has no equivalent to any of that. There is no reliable automated statistics system at World Tour level. There is no standard for placement data. There is no official analytics platform supplying detailed match data to the public.
This is not because badminton is more complex than tennis. In fact, badminton may be easier to measure in many ways, because the court is smaller, rallies are shorter, and there are fewer players on court. The cause lies in the market and in the governing body's priorities. Badminton has a vast player base in Asia, but broadcast rights revenue far below tennis, and that makes investment in data infrastructure less economically attractive.
But the cost is not money. The cost is the ability to understand the game. A sport that cannot measure itself will struggle to communicate its value to new audiences, to sponsors, and to the next generation of athletes.
What would change if data were fuller
A natural question arises: if badminton had full data, how would everything change?
At the analytical level, it would completely change the debates. The question of who is the best player would depend less on viewers' memories and more on verifiable analysis. Players who were underrated for competing at less-visible events would get a chance to be judged fairly.
At the coaching level, it would change how tactics are built. Instead of relying on feel, coaches could rely on data to identify an opponent's specific weaknesses in specific phases of a match. Opponent analysis would become a systematic process rather than an oral tradition.
At the audience level, it would change how matches are retold. Fans would have more to argue about, and understanding of the sport would deepen. A sport whose fans understand it in detail will have more loyal fans.

At the athlete-welfare level, it would help extend careers. With data on match tempo and point distribution, workload and recovery management would be more precise. Many badminton injuries stem from playing too many high-intensity matches without early warning signs.
And at the global level, it would help smaller badminton nations compete more fairly. A Vietnamese player, a Thai player, a Taiwanese player would no longer depend on the uneven attention of international broadcasters to be analysed properly.
But the most important thing full data brings is not conclusions. It is questions. With more data, people do not necessarily agree more. They simply argue at a deeper, more specific, more interesting level. And that is what any sport needs to keep itself alive.
The counterintuitive point: badminton does not lack data, it lacks recorders
Here is what surprises many people when I say it: badminton does not lack data. Badminton lacks recorders.
The match was played, the rally existed, the decision was made, and all of it was observable. The problem is not that the information does not exist. The problem is that nobody logs it systematically.
This sounds like a purely technical issue. But it has deeper consequences. When an analytical culture relies on memory rather than records, it tends to favour what is easy to remember. Spectacular rallies are remembered. Rallies that quietly accumulate advantage are forgotten. Big matches are remembered. Small matches, even those that decide rankings, are skipped.
The people most affected by this tendency are not the top players. They already get enough attention. The people affected are the mid-tier players — the group that decides most of this sport's competitiveness, yet receives the smallest share of analytical attention.
This is why I believe the most urgent task for the current generation of badminton analysts is not building complex models. The task is recording. Sit down, watch the replay, and carefully log what happened. Do it for one match, two matches, a hundred matches. Build a database from the ground up. Without that foundational step, any model, however sophisticated, is a house built on sand.
What Vietnam must do to avoid depending on other people's data
For Vietnamese badminton, the global data gap is both a difficulty and an opportunity.
A difficulty, because Vietnamese players are rarely analysed internationally, so their progress is under-recognised. An opportunity, because in a landscape where even large federations have not systematised data, a small badminton nation can leap ahead by doing it first.
The first task is to record our own players. For every national-team player, there should be a seasonal data profile: point distribution by game phase, average rally length, win rate at key points, placement tendencies, and frequency of tempo changes. This data can be produced by watching international replays, with no special equipment.
The second task is to systematise tracking of regional opponents. Thai, Indonesian, Malaysian and Singaporean players are regular opponents. Building data profiles on them is the single most important match-preparation tool a small badminton nation can invest in.
The third task is to connect data with media. Data is most valuable when it reaches the public. A badminton nation that has data but cannot retell it to audiences will gain nothing from the logging. And this is where the media's role becomes essential — not merely to report, but to translate numbers into human stories.
Signals to track through the season
In the ongoing World Tour season, there are a few signals I will watch closely, and all of them relate to the data gap one way or another.
The first is whether the BWF publishes any new statistical metric. Even a small one, such as point distribution by game phase, would be a significant step up from the status quo.
The second is the emergence of independent analytics providers. When private platforms start producing detailed badminton data, that is a sign the market has recognised the sport's value.
The third is the reaction of players and coaches. If they begin citing numbers in interviews, that is a sign the analytical culture is changing from within.
The fourth, and perhaps most important for Vietnamese viewers, is whether Vietnamese players enter international analytical models. Regular appearance in international analysis is an indirect measure of recognition.
Open conclusion: reading the match with what you log yourself
There are curves on a badminton court that only someone who has sat through thousands of matches can draw again.
When I think about the future of badminton analysis, I do not imagine a perfect data system falling from the sky. I imagine a new generation of recorders: people willing to sit down, rewatch and write down what they saw. A community working to the same standard and the same patience.
Badminton is a sport in which any serious analysis must begin by accepting that you are short of information. Not because the analyst is weak, but because the infrastructure has not given them what they need. Inside that gap, the only way forward is to create your own data, and to read the match with what you log yourself.
A player steps onto court with everything they have prepared. They do not have complete data on themselves. They must trust instinct, body memory, and everything they have trained. That is another kind of data — data held in the body, not in a computer.
Analysts are the same. When there is not enough data, we must learn to trust our eyes, while at the same time building our own small databases so that our eyes do not lose their way. Between two breaths lie decisions the scoreboard will never retell. Our job is to find a way to retell them.
The question is not whether badminton will ever have a data system worthy of its speed. The question is who will start recording first, and what they will choose to record when nobody has asked them to.